Portfolio
Team Project: Chrome Extension for Breaking Barriers
Our team project is a Chrome extension designed to break communication barriers for deaf users, especially deaf students. The extension provides real-time captioning and integrates gesture/sign recognition technologies to convert spoken language into on-screen text and visual cues.
Enhanced Project Description: In addition to its core functionality, our project is backed by data insights showing that many deaf students perform roughly two grade levels below their hearing peers in online learning environments. With about 40% of deaf students experiencing difficulties in following online lectures due to the absence of real-time captions, our solution aims to boost comprehension by over 30%—potentially increasing understanding from 60% to 78%.
Download SonnarSage Team Phase 2 Project PDF
Data-Driven Impact
Real Data Highlights: Research indicates that many deaf students perform roughly two grade levels below their hearing peers in online learning settings. Approximately 40% of deaf students report difficulty following online lectures due to the lack of real-time captions. Our extension aims to boost comprehension by over 30%, potentially increasing understanding from 60% to 78%.
Data Analytics Project: Billionaire Analysis Dashboard (2025)
Created an interactive Excel dashboard analyzing global billionaire wealth distribution and demographics. This comprehensive analysis provides insights into wealth patterns, industry concentrations, and demographic characteristics of the world's wealthiest individuals in 2025.
Key Dashboard Metrics:
- Average Net Worth: $14,824 million across the dataset
- Average Age: 56.47 years
- Total Billionaires Analyzed: 129
- Regional Distribution: APAC, EMEA, LATAM, NA
Click on the image to enlarge it for a better view.
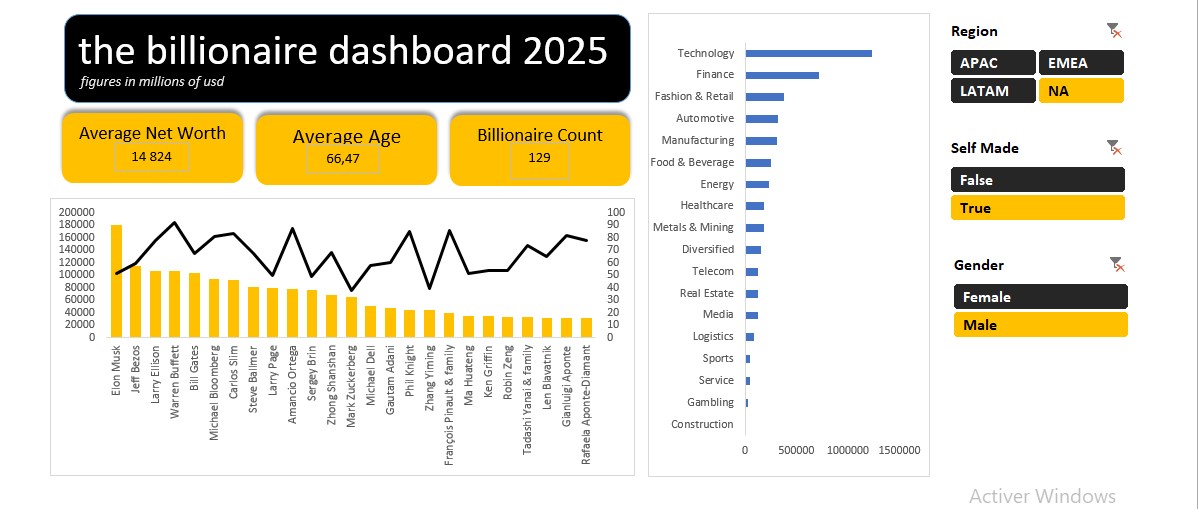
Key Findings: Analysis reveals technology and finance sectors dominate wealth concentration, with significant representation from APAC and EMEA regions. The dashboard enables dynamic filtering by region, gender, and self-made status, providing comprehensive insights into global wealth distribution patterns.
Other Projects
Data Analytics Project: Beverage Sales Dashboard (2025)
Designed an interactive Power BI dashboard to analyze beverage sales performance across different states and months. This dashboard provides insights into revenue distribution, units sold, and price per unit for major beverage brands.
Key Metrics:
- Total Revenue: 1.92M
- Units Sold: 3.98M
- Average Price per Unit: 0.47
Click on the image to enlarge it for a better view.
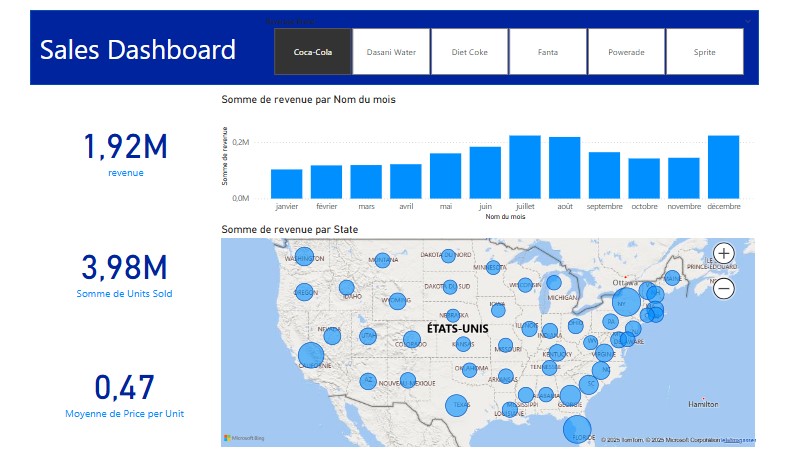
Key Insights: The dashboard showcases beverage sales trends over time, regional revenue distribution, and price analysis. The interactive filters allow dynamic exploration of different beverage brands and time periods, helping businesses optimize sales strategies.
Data Analytics Project: Walmart Sales Analysis (2025)
Conducted an in-depth sales analysis using SQL and Power BI to uncover key business insights from Walmart's transaction data. The analysis focuses on revenue trends, customer behavior, and product performance.
Key Insights:
- Top-Selling Product Line: Health & Beauty
- Most Common Payment Method: E-wallet
- City with the Highest Revenue: Yangon
- Peak Sales Time: Evening (6 PM - 9 PM)
- Customer Type Spending the Most: Member Customers
Key Findings: The analysis identifies the best-performing products, peak sales periods, and customer preferences. These insights can help Walmart optimize inventory, pricing strategies, and marketing efforts.
Data Analytics Project: HR Employee Distribution Dashboard (2025)
Designed an interactive Power BI dashboard analyzing employee distribution across various demographics, locations, and departments. This dashboard provides insights into workforce diversity, termination rates, and employment trends over time.
Key Dashboard Metrics:
- Gender Distribution: 8.9K Male, 8.1K Female, 0.5K Non-Conforming
- Workforce Location: 75% Remote, 25% Headquarters
- Average Length of Employment: 11 Years
- Top Departments by Termination Rate: Auditing (23.07%), Legal (20.25%)
- Race & Age Group Distribution Breakdown
Click on the images to enlarge them for a better view.
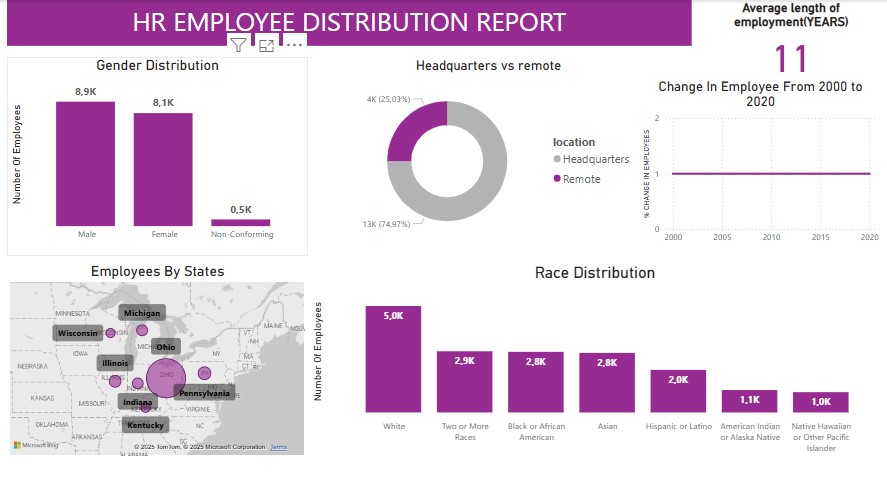
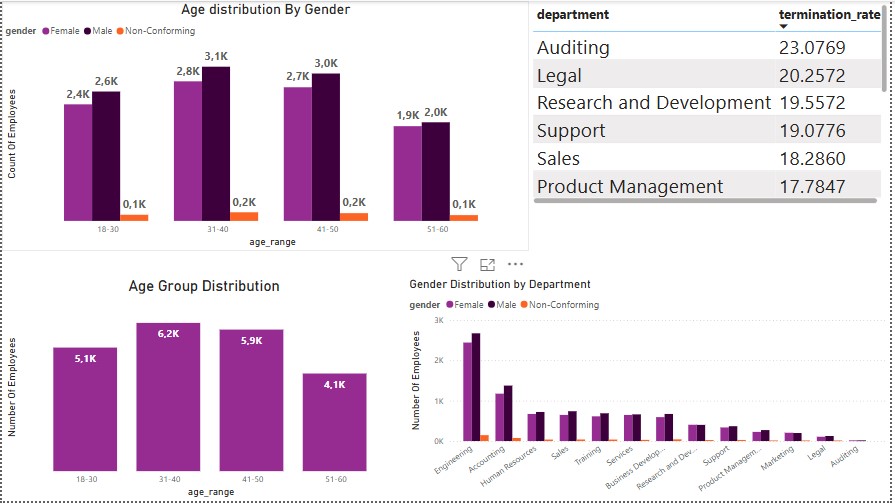
Key Findings: The analysis highlights workforce diversity across gender, race, and location. The dashboard also reveals trends in termination rates by department and age group distribution, providing valuable insights for HR decision-making.
Data Analytics Project: Fitness Tracking App Insights (2025)
Developed a comprehensive Power BI dashboard analyzing user behavior and performance metrics from fitness tracking application data. This end-to-end analysis reveals key correlations between workout patterns, intensity levels, sleep habits, and overall fitness outcomes.
Key Dashboard Metrics:
- Average User Age: 38 years
- Average Height: 174 cm
- Average Weight: 85 kg
- Gender Distribution: Balanced representation across male, female, and other identities
View Full Project Files | Watch Analysis Video
Click on the images to enlarge for a better view.


Key Findings: Analysis demonstrates strong correlations between workout intensity and calorie expenditure, with pre-workout mood significantly impacting performance outcomes. The dashboard reveals balanced engagement across diverse workout types (HIIT, strength, yoga, cycling, cardio, running) and identifies optimization opportunities in sleep patterns for improved fitness results.
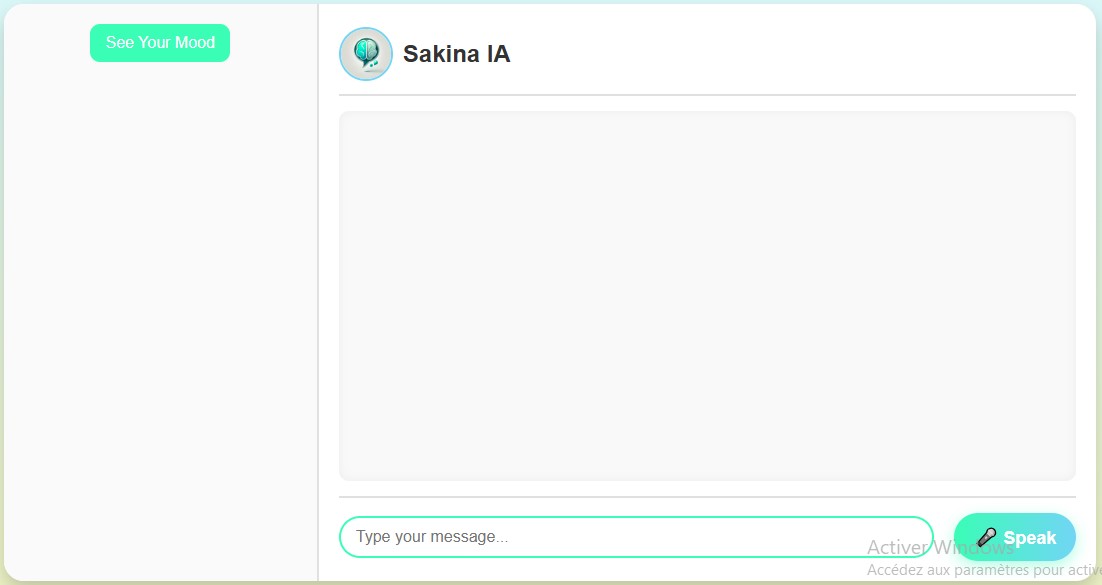
SAKINA AI
Guide: GitHub link: https://github.com/anassriad/psychology-chatbot
SAKINA AI is a unique fusion of psychology and art. This AI-powered tool offers personalized mental health insights using natural language processing. With the innovative "See Your Mood" button, it analyzes the last 10 messages exchanged between the user and the bot to create a custom mood painting in the style of Salvador Dalí.
Technologies used: Node.js, Express, OpenAI, JavaScript, NLP
Click on the images to enlarge them for a better view.


Live website: Coming soon.
Analytical Insight: With growing awareness of mental health and creative expression, research shows a significant rise in engagement for innovative, artistic approaches to emotional support. PSYCHIATRYONLINE.ORG
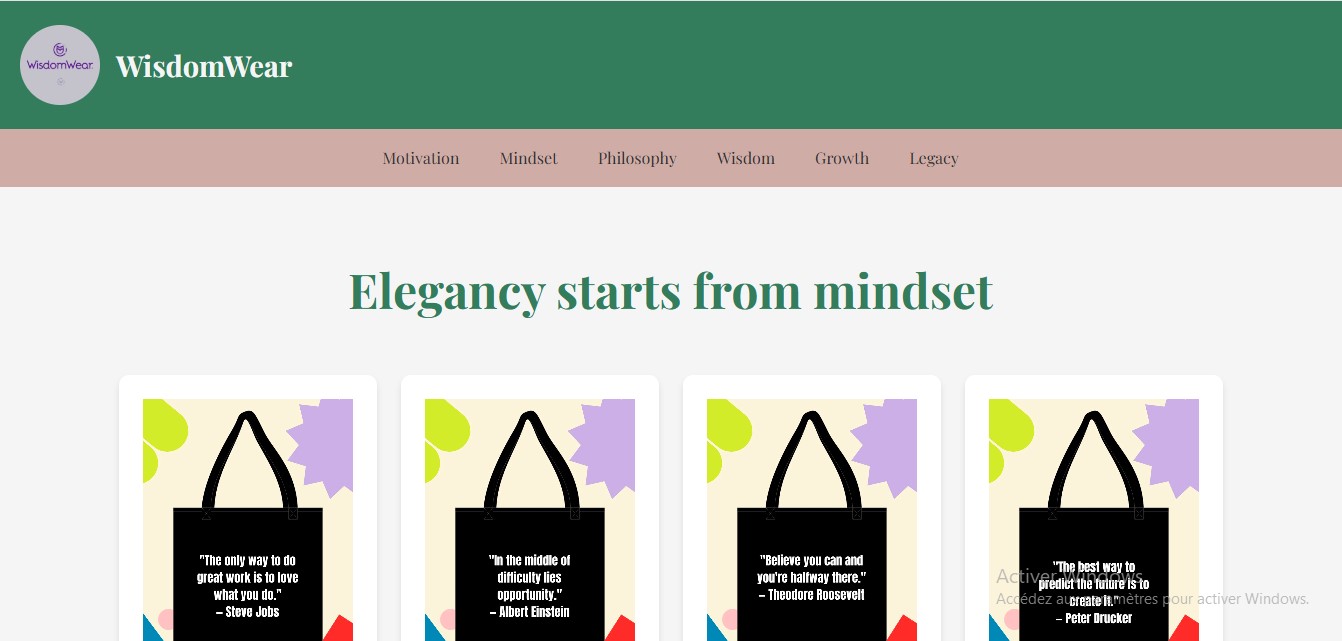
Wisdom Wear
Guide: GitHub link: https://github.com/anassriad/anassriad.github.io
Wisdom Wear is an online store selling totebags featuring unique quotes from wise and inspiring individuals. The site categorizes quotes into Mindset, Philosophy, Wisdom, Growth, and Legacy. Currently, it focuses on totebags, with plans to expand into additional apparel.
Technologies used: HTML, CSS, JavaScript, Netlify
Click on the images to enlarge them for a better view.
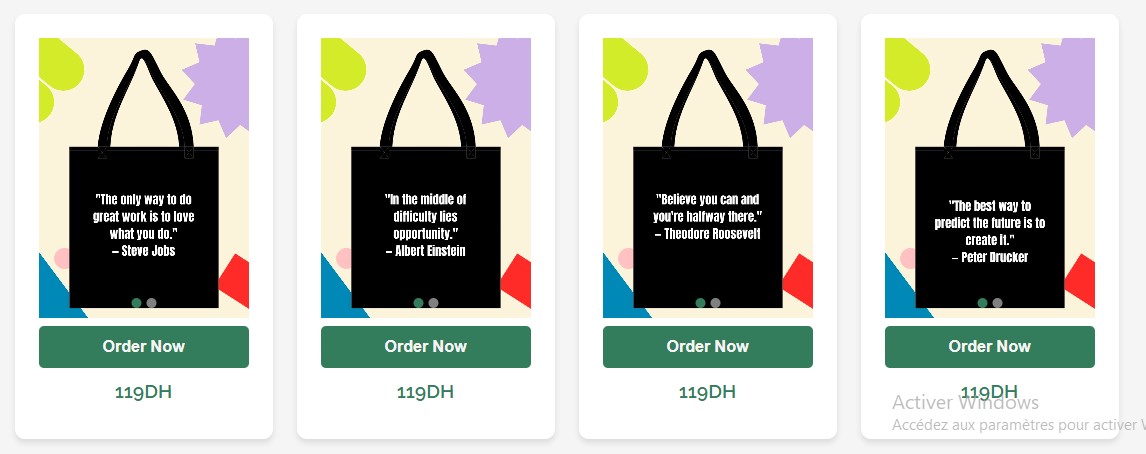
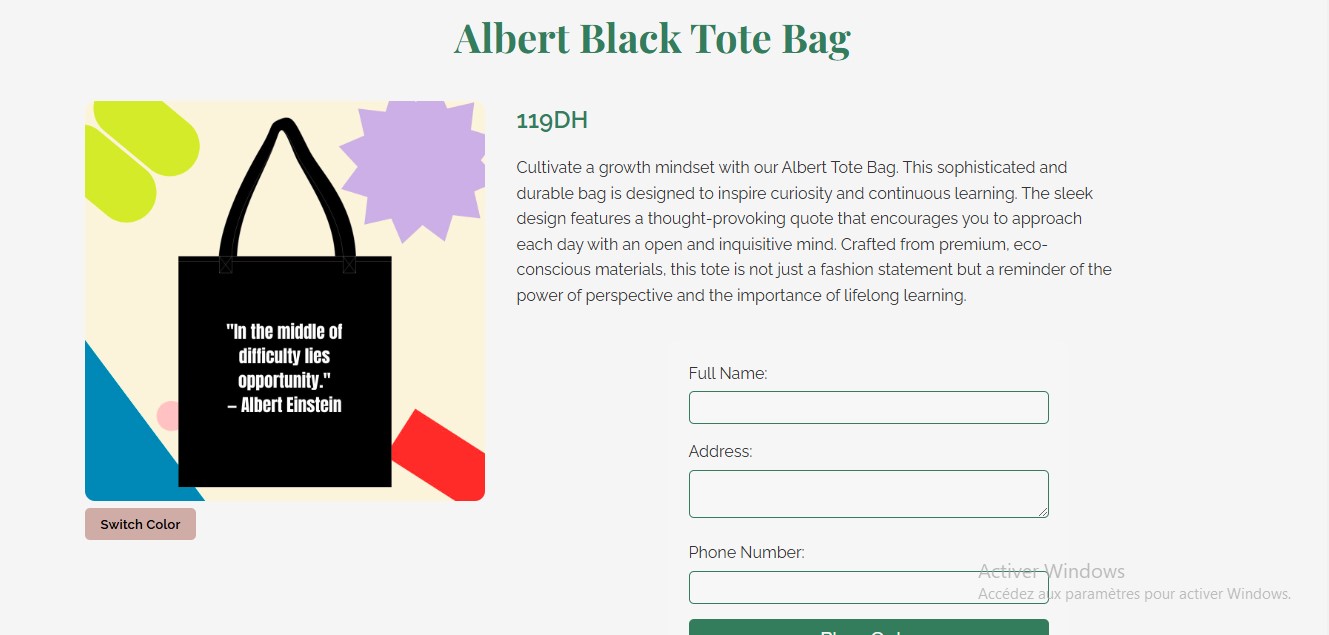
Analytical Insight: E-commerce trends show that niche products like custom totebags can boost conversion rates by 20-25% when targeted effectively.
Water Scarcity Analytics in Morocco
Water scarcity is a critical issue in Morocco, affecting agriculture, urban supply, and ecosystems. Recent data indicates a gradual decrease in per capita water availability driven by climate change and increased demand.
Analytical Insight:
Marathon Morocco
Guide: GitHub link: https://github.com/anassriad/marathon-morocco
A platform for organizing and tracking marathon events in Morocco, designed to enhance the experience for both organizers and participants.
Technologies used: HTML, CSS, JavaScript, Node.js
Click on the image to enlarge it for a better view.
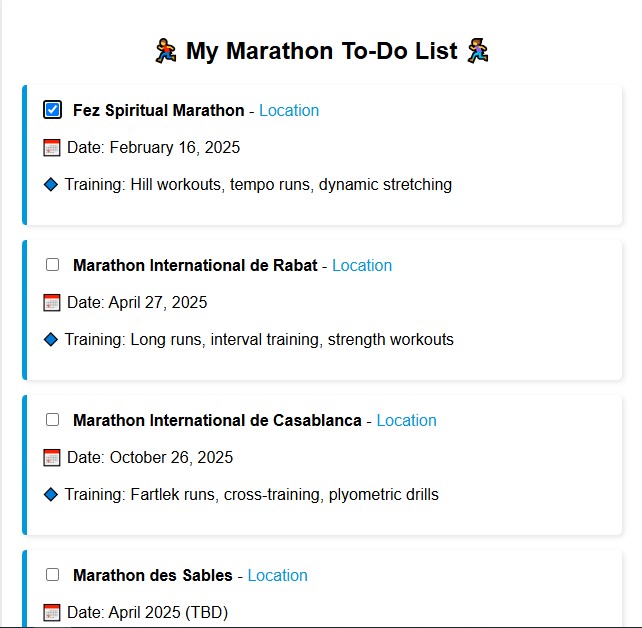
Analytical Insight: With a steady 15% annual growth in marathon participation, our platform meets a growing need among fitness enthusiasts.